MD tviti od 22.5.2017
1/Svet danes vs pred 35 leti; BDP 11.000→75.000mlrd.$; FDI 100→25.000mlrd.$-graf. Svet se spreminja hitreje kot SLO https://www.ecb.europa.eu/pub/pdf/scpwps/ecb.wp2066.en.pdf
2/ Velikost+dinamika FDI v svetu=»eksplozivna«; 1980=1%GDP - 2014=33%GDP. Euro area=20%inflowFDI, vendar po krizi stagnira; rast drugje pa↑!
3/SLO inflow FDI stanje=12,0mlrd.€; v zadnjih 3-eh letih ≈1mlrd€/l. Žal=večina rezultat nuje-izogiba bankrota. Zastoj izhodnih+izgube v exYU
4/ Bo v nasl.4-letih inflow FDI 2mlrd..€/l.→2020=20mlrd..€! In dolg 30+10=40mlrd.€-100%BDP? T.j.suverenost v številkah+breme za nasl.generac
No 2066 / May 2017 (Excerpt by MD)
https://www.ecb.europa.eu/pub/pdf/scpwps/ecb.wp2066.en.pdf
The euro area continues to be a key recipient of FDI. In 2015, the euro area accounted for 20% of the global stock of FDI. Yet, in recent years, attracting FDI inflows into the euro area has become increasingly challenging and the euro area has been losing importance as an investment destination.
Having well-functioning institutions and markets in the host country could from a theoretical point of view encourage capital transfers into a country for a variety of reasons… Moreover, we also confirm earlier findings of the literature, namely the importance of other determinants of FDI inflows, such as labour costs, the size of the target market (as proxied by its economic activity), the trade openness of the recipient country as well its tendency to tax economic actors.
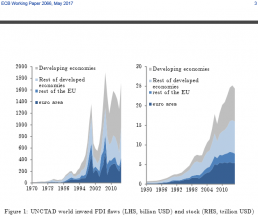
Between 1980 and 2014, the world FDI stock — defined as cross-border expenditures to acquire or expand corporate control of productive assets — has increased from less than 1 trillion (or 6% of world GDP) to almost 25 trillion USD (or 33% of world GDP). This rapid growth in cross border investment has to a large extent been due to the reduction in trade and investment barriers, the harmonisation and mutual recognition of regulation and the removal of domestic impediments through reform and privatisation (see OECD, 2001). Instead of barriers, many countries now employ actual incentives to attract FDI. Incentive-based competition for FDI has meanwhile become a wide-spread phenomenon, involving governments at all levels (national and sub-national) in both OECD and non-OECD countries (Oman, 2000).
Both theoretical and empirical studies have documented the positive impact of FDI on potential growth. Such effects materialize as FDI improves the transfer of technology and know-how, increases competition and pushes for more positive development of firms. However, studies have also shown that such effects only take place when a host country has reached a basic level of development and adopts appropriate policies (OECD, 2002). These channels, under the right conditions, can in turn be expected to make countries more competitive, productive and thus help stimulate their growth potential.
The euro area continues to be a key investor and recipient of FDI. This is the case despite that since the mid-2000s, emerging markets have becoming increasingly important as hosts to foreign owned firms. In 2015, one third of the global inward FDI stock was directed to the EU and one fifth to the euro area (see Figure 1) and FDI continues to play a more important role for many euro area countries than for other industrial economies (such as the US or Japan).
In recent years, attracting FDI inflows into the euro area has become increasingly challenging. After the strong FDI inflows during the 1990s ahead of the creation of the monetary union and with the creation of the single market, the euro area has been losing importance as an investment destination, a trend which is continuing up to this day. As a result, the euro area share in world inward FDI has declined from 31% in 2008 to 21% in 2014, reflecting the decline in inflows in euro area countries while developing countries have witnessed historically high inflows (see Figure 1)